

React Native Debugger: Best Tools and How to Use Them
React Native debuggers are an essential aspect of React Native development, ensuring that applications run efficiently and provide a seamless user experience. React Native’s hybrid nature—combining JavaScript and native components for iOS and Android—offers flexibility but also introduces unique challenges. Issues like network failures, complex state management, and performance bottlenecks can slow down development without the right tools.
In this blog, we’ll dive into the top React Native debugger tools, highlighting their pros, cons, and practical uses. These tools simplify debugging by providing features such as state inspection, network monitoring, and performance profiling. Whether you’re troubleshooting a small bug or optimizing your app’s performance, this guide will help you select the right tool to streamline your workflow and build reliable applications.
Foundational Concepts
What is Debugging in React Native?
Debugging in React Native involves identifying, analyzing, and resolving issues that arise during development. These issues can range from minor bugs affecting UI rendering to critical errors impacting app functionality. Unlike traditional development environments, React Native introduces unique challenges due to its hybrid nature—bridging JavaScript with native code for iOS and Android.
Effective debugging in React Native requires tools that handle the nuances of cross-platform development, such as bridging errors, network issues, and performance optimization.
Common Debugging Challenges
- Network Issues: Debugging network-related problems like API failures, latency, or incorrect data handling can be challenging, especially when handling asynchronous requests.
- State Management Complexity: Managing and debugging app state, particularly in complex applications using libraries like Redux, often requires tracking state changes and actions.
- Performance Bottlenecks: Identifying areas where the app slows down, such as inefficient rendering or heavy computations, is critical for ensuring a smooth user experience.
Key Features to Look for in a Debugger
To effectively debug React Native applications, the tools you choose should provide:
- State Inspection: The ability to monitor and manipulate app state in real time, including viewing and tracking state changes.
- Network Monitoring: Tools that capture and display network requests, enabling you to debug API calls and data flows.
- Performance Profiling: Insights into app performance, highlighting areas that need optimization, such as component rendering or memory usage.
Selecting a debugger with these capabilities will empower you to quickly identify and resolve issues, ensuring a robust and user-friendly application.
Top React Native Debugging Tools
Debugging React Native applications effectively requires tools that address specific scenarios, from tracking state changes to diagnosing performance bottlenecks. Below are the top React Native debugger tools, with insights into their features, scenarios they address, and use cases.
React Native Debugger
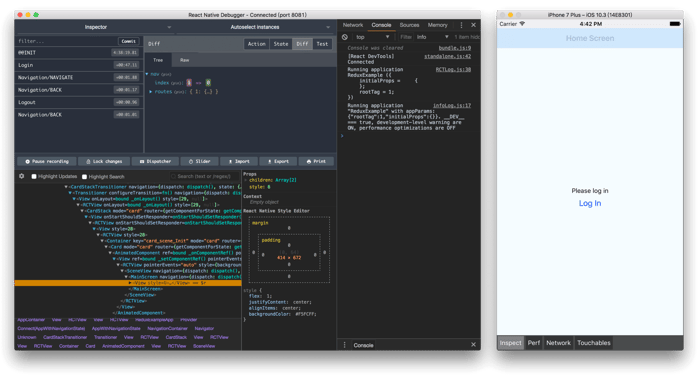
React Native Debugger is a standalone desktop tool that integrates React DevTools and Redux DevTools, making it invaluable for state-heavy applications. It excels in debugging Redux-based state management, offering features like tracking actions, inspecting state changes, and viewing network requests.
- Scenarios:
- Debugging Redux state changes when implementing features like user authentication or cart management in an e-commerce app.
- Monitoring network requests in real time when troubleshooting API failures.
- Pros: Combines React and Redux debugging; supports advanced state inspection and time travel debugging.
- Cons: Requires configuration; may feel overwhelming for beginners.
- Usage: Download React Native Debugger from its GitHub repository. Launch the debugger, then start your app with
react-native start --reset-cacheto connect it. Use the integrated Redux DevTools to track state actions and transitions.
Flipper
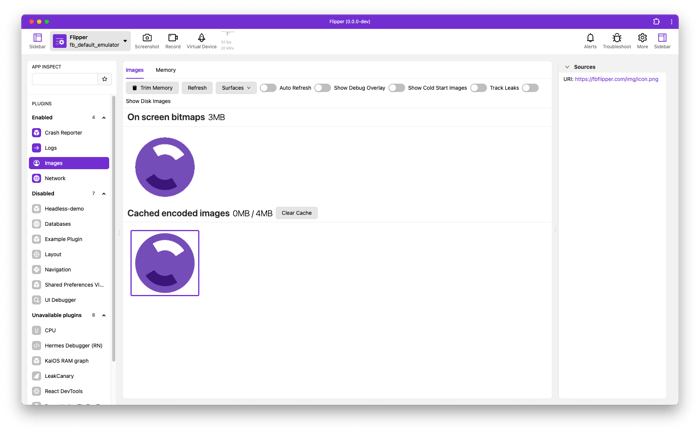 Flipper, developed by Meta, is an extensible debugging tool designed for both React Native and native apps. It is ideal for inspecting layouts, analyzing network traffic, and debugging logs. With its plugin ecosystem, it can handle complex app scenarios efficiently.
- Scenarios:
- Debugging UI layout issues where components overlap or are misaligned, such as in responsive designs.
- Analyzing failed network requests in apps using REST or GraphQL APIs.
- Pros: Extensible with plugins like Layout Inspector; supports native and React Native debugging.
- Cons: Resource-intensive, especially with multiple plugins active.
- Usage: Install Flipper from its official website. Add the Flipper React Native plugin to your project. Use the Layout Inspector to debug UI hierarchies or the Network plugin to inspect failed or slow API calls.
Reactotron
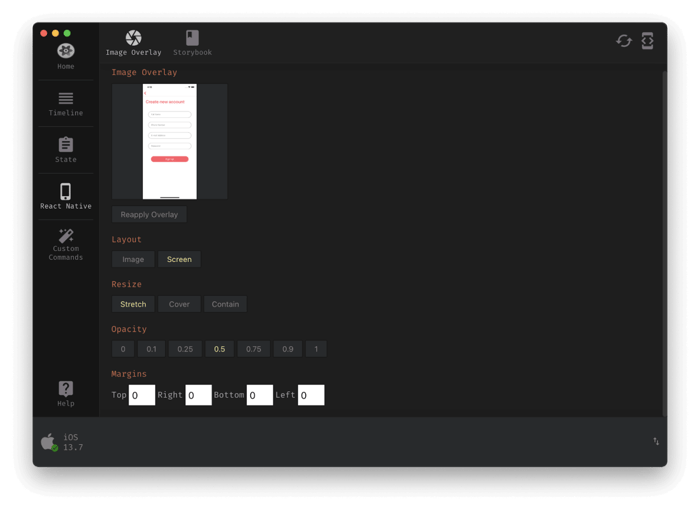
Reactotron is a lightweight, open-source desktop application ideal for monitoring API requests, state changes, and performance metrics. It provides real-time logs, making it perfect for debugging during active development.
- Scenarios:
- Tracking API requests and responses in apps with heavy data fetching, like dashboards or analytics platforms.
- Monitoring app performance during animations or complex state transitions.
- Pros: Real-time insights into state and API calls; lightweight and easy to set up.
- Cons: Lacks advanced debugging features like those found in Flipper or React Native Debugger.
- Usage: Install Reactotron via npm and follow the setup instructions on the Reactotron GitHub page. Use it to monitor API activity and validate state transitions.
LogBox
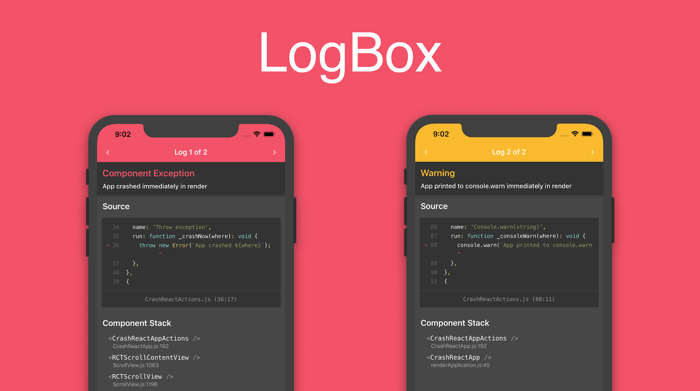
LogBox is a built-in debugging tool in React Native that focuses on runtime warnings and error logs. It helps developers catch and fix issues early during the development process.
- Scenarios:
- Catching and fixing runtime warnings like deprecations or incorrect prop types in components.
- Debugging JavaScript errors in production mode during testing.
- Pros: Built into React Native; requires no setup.
- Cons: Limited to displaying warnings and errors.
- Usage: Use
LogBox.ignoreLogs(['Warning message'])to filter specific warnings, orLogBox.ignoreAllLogs(true)to suppress all logs during development. LogBox is particularly useful for cleaning up noisy warnings in larger projects.
The Developer Menu
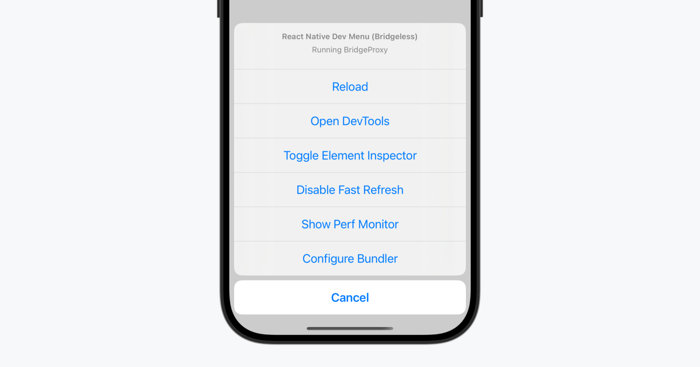 The Developer Menu is a built-in feature in React Native, providing quick access to debugging essentials. It includes tools for hot reloading, performance monitoring, and network inspection.
- Scenarios:
- Quickly reloading the app during UI development to view live changes.
- Checking performance metrics while testing animations or transitions.
- Pros: Always available; no installation required.
- Cons: Limited functionality compared to standalone tools.
- Usage:
- On iOS, shake the device or press
Cmd + Dto open the menu. - On Android, shake the device or press
Ctrl + M. Use features like “Enable Performance Monitor” to view FPS and memory usage.
- On iOS, shake the device or press
Choosing the Right Tool
Each tool is suited to different use cases and scenarios:
- Use React Native Debugger for apps with heavy state management (e.g., Redux or Context API).
- Opt for Flipper when dealing with UI layout issues or advanced network debugging.
- Choose Reactotron for lightweight, real-time insights into state and API interactions.
- Rely on LogBox for quick troubleshooting of warnings and errors during development.
- Use the Developer Menu for quick debugging and reloading needs.
By combining these tools strategically, developers can address a wide range of debugging challenges, ensuring a smoother development process and a more reliable React Native application.
Comparative Analysis
Here’s a quick comparison of the top React Native debugging tools to help you decide which one suits your needs:
| Tool | Features | Ideal Use Case | Complexity |
|---|---|---|---|
| React Native Debugger | Redux/React integration | State and Redux debugging | Medium |
| Flipper | Extensible with plugins | Layout/network debugging | Medium |
| Reactotron | Real-time monitoring | API calls and performance | Low |
| LogBox | Runtime error logs | Quick error inspection | Low |
| Developer Menu | Built-in features | General debugging | Low |
How to Choose the Right Debugger
Selecting the right React Native debugger depends on your specific requirements:
- React Native Debugger: Ideal for applications with complex state management, especially those using Redux. It provides deep insights into actions and state changes.
- Flipper: Best for debugging UI layouts, inspecting network traffic, and leveraging plugins for extended functionality.
- Reactotron: Perfect for real-time monitoring of API requests and application state during active development.
- LogBox and Developer Menu: Use these built-in tools for quick fixes and error inspection, especially during early development or testing phases.
For complex workflows, consider combining tools. For instance, pair React Native Debugger with Flipper to handle both state management and network debugging effectively.
Best Practices for Debugging
Adopting best practices can make debugging more efficient:
- Write Clean, Modular Code: Organizing code into smaller, reusable components makes it easier to identify and resolve issues.
- Use Logging Judiciously: Leverage tools like
console.logfor simple debugging and LogBox for filtering runtime warnings. - Regularly Update Tools: Keep debugging tools up to date to ensure compatibility with the latest React Native versions and access new features.
- Test Incrementally: Debug in smaller increments to isolate issues faster rather than testing large sections of code at once.
- Document Known Issues: Maintain a record of resolved bugs and their fixes to avoid repeating errors.
By following these practices and using the right tools, you’ll streamline the debugging process and enhance the quality of your React Native applications.
Related articles

Development using CodeParrot AI


